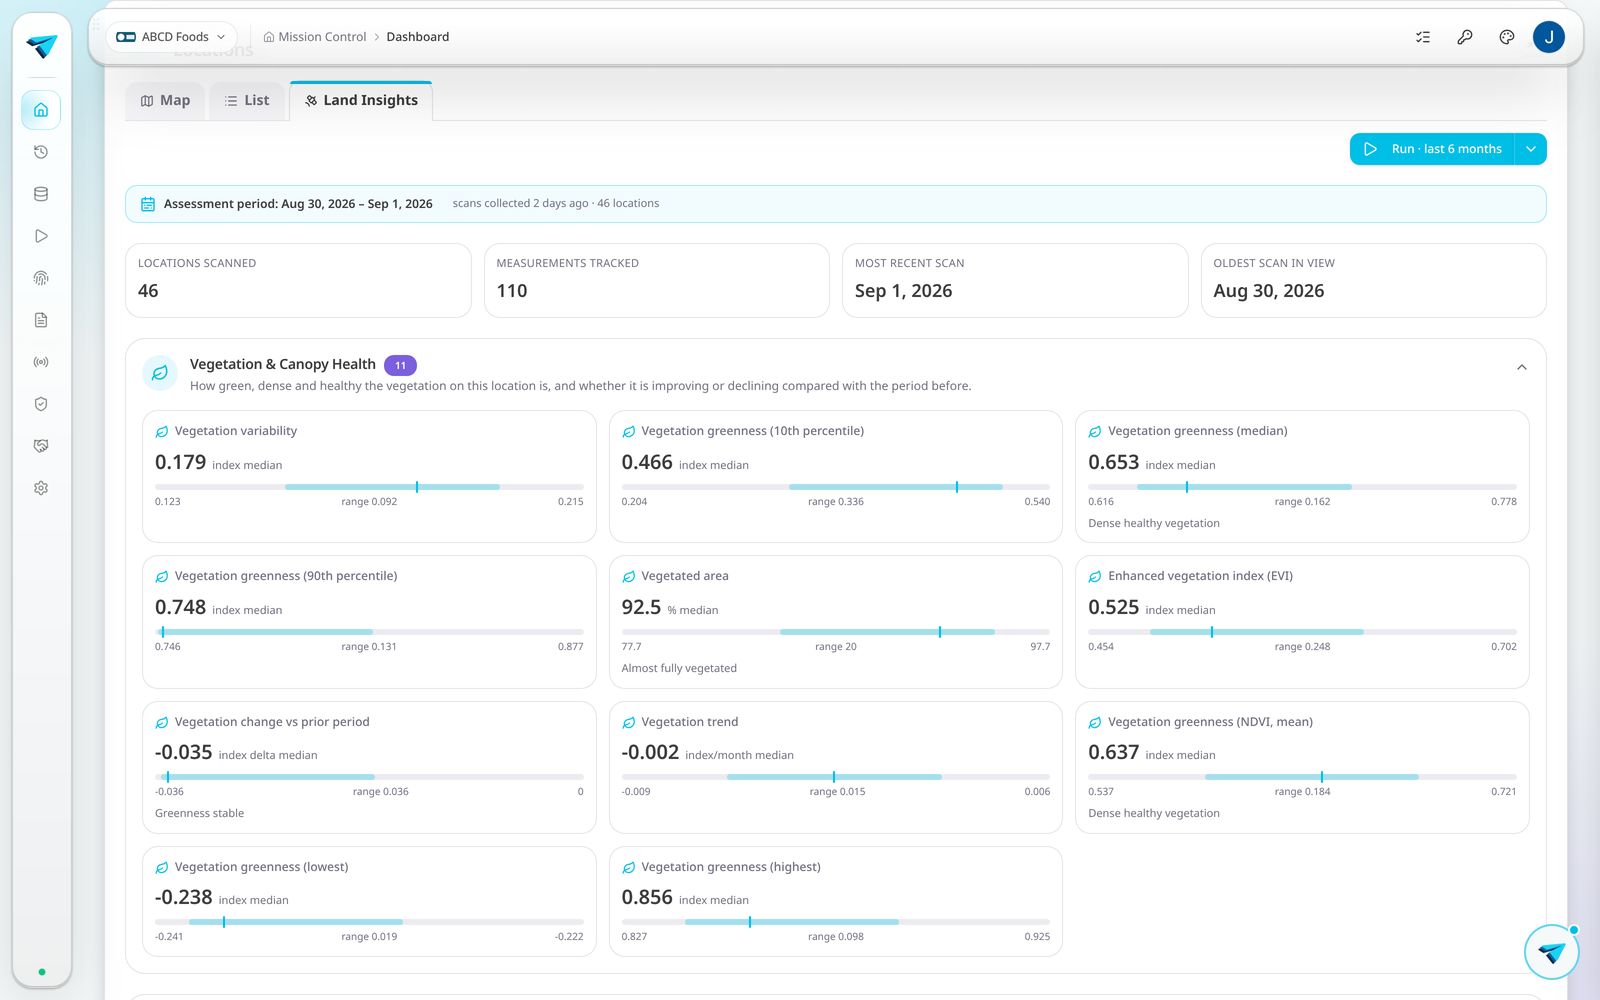
Land Insights
Know the land behind every lot,
plot by plot.
Land Insights turns satellite and partner data feeds into plain answers about the locations you source from — forest change, water stress, soil condition and climate exposure — all bound to the plot boundaries already in your orbit.
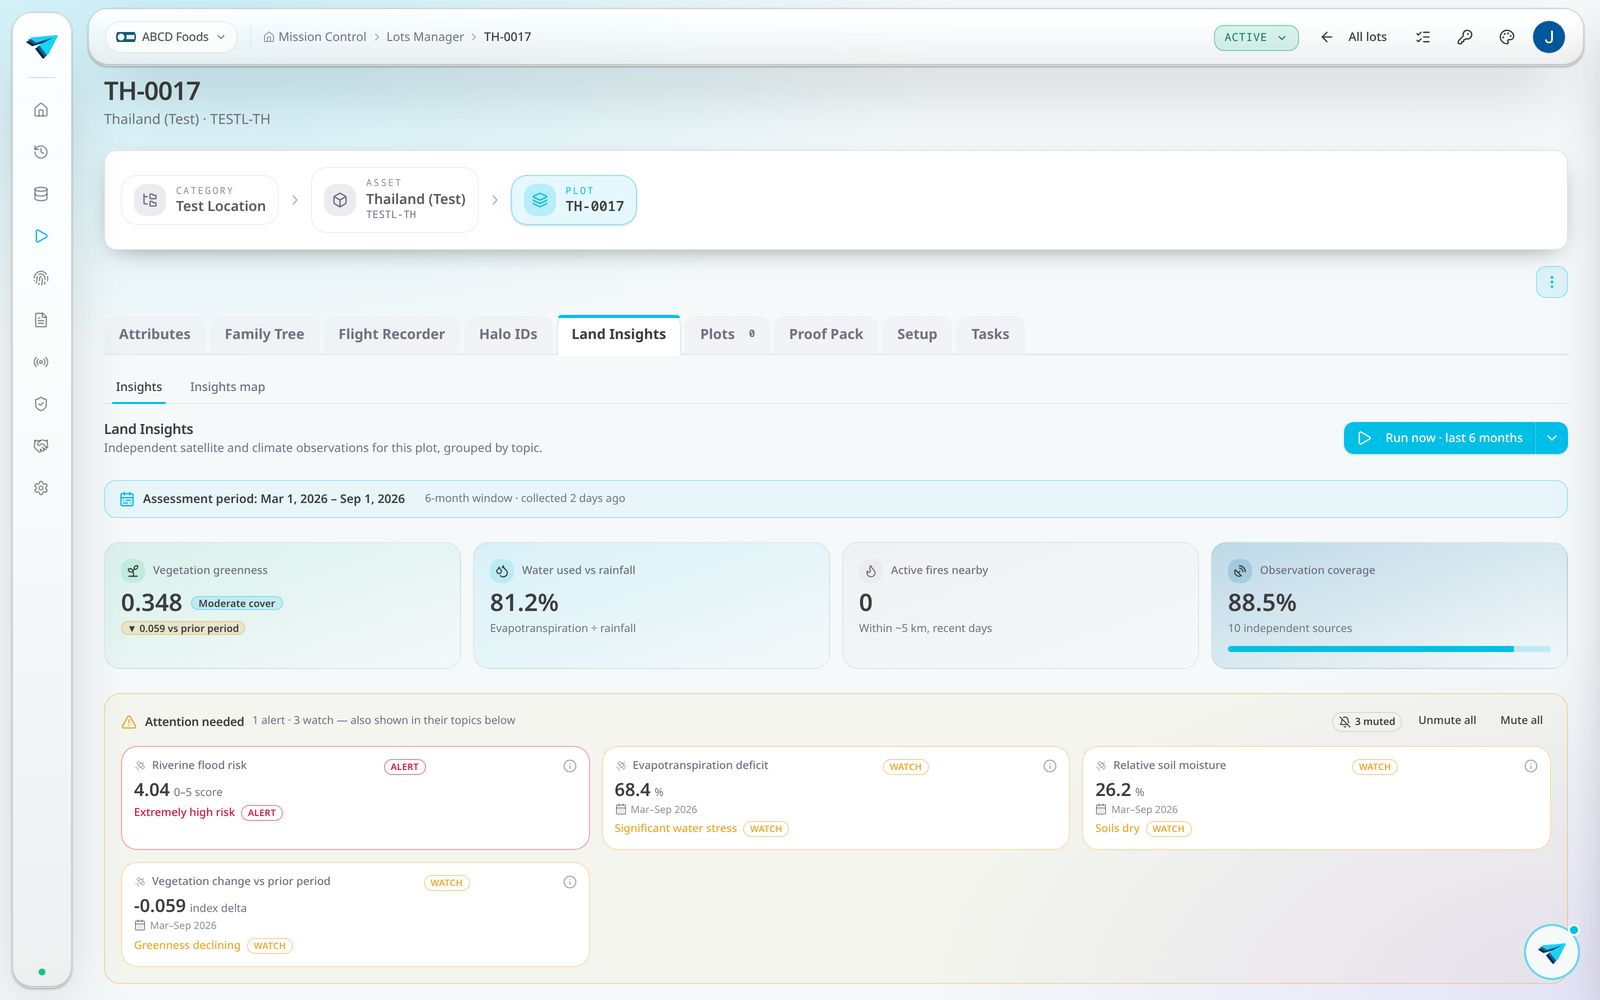
What Land Insights gives you
Satellite feeds, already wired in
Canopy cover, forest change, vegetation health and land cover are pulled per plot boundary. No GIS team, no manual downloads.
Water and climate risk
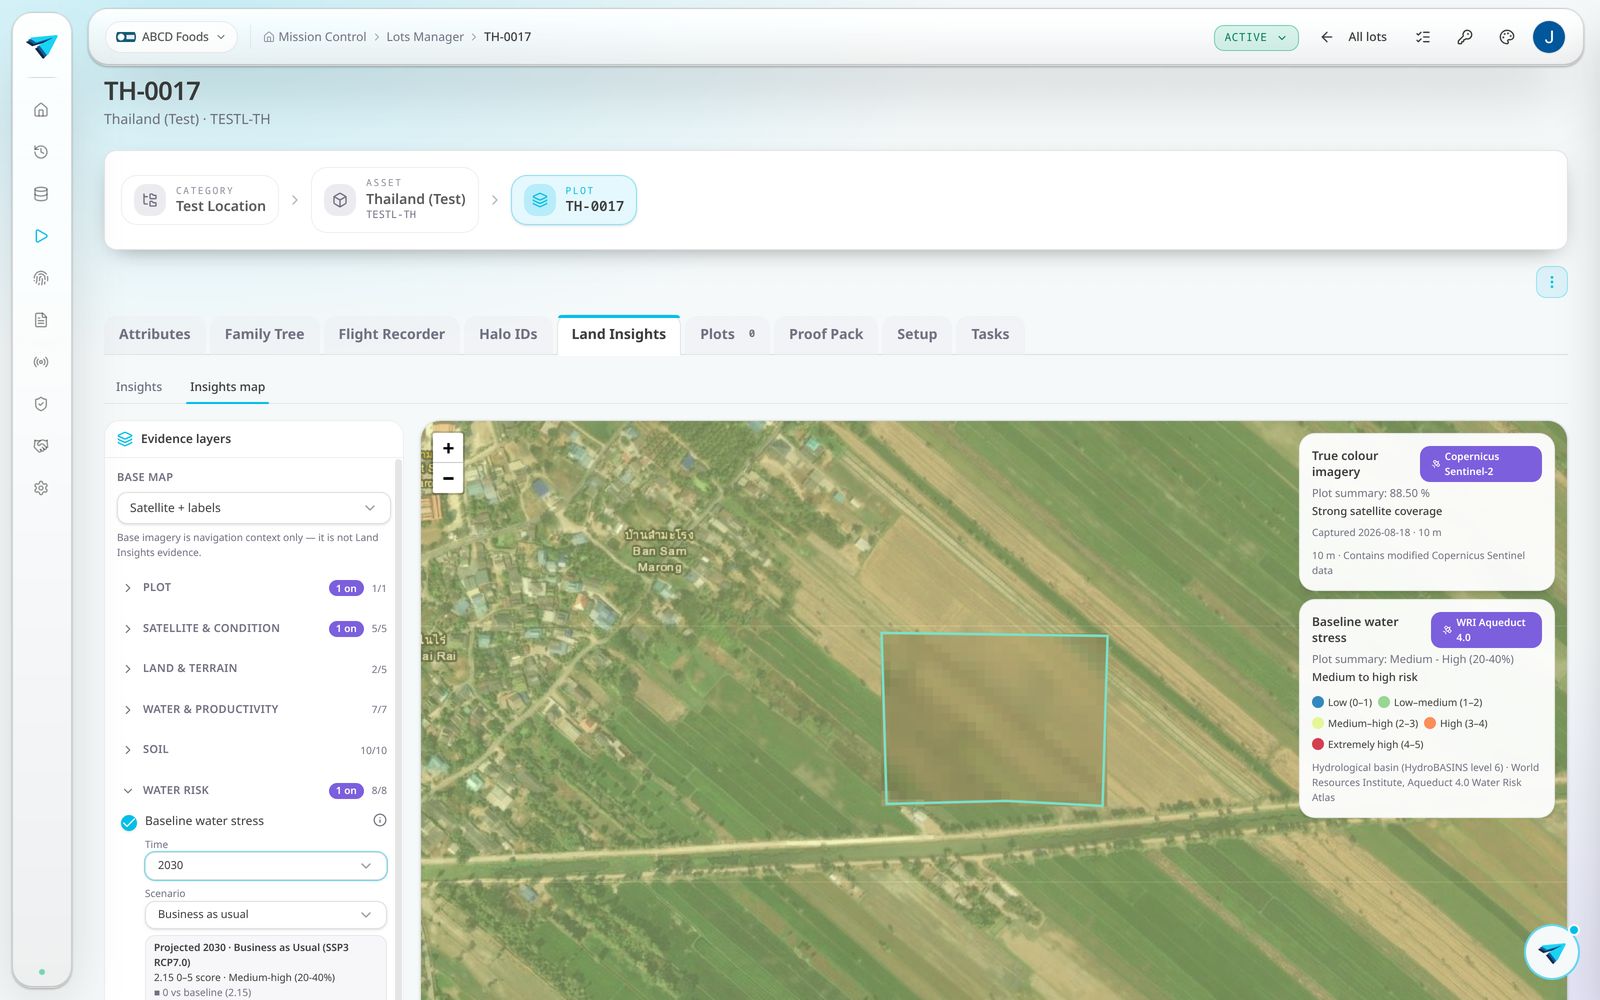
Basin water stress, rainfall and temperature trends are scored against each plot so you can see exposure before it becomes a shortfall.
Soil and productivity signals
Soil carbon, organic matter and productivity indicators give agronomists and buyers a shared view of land condition over time.
Layer by layer
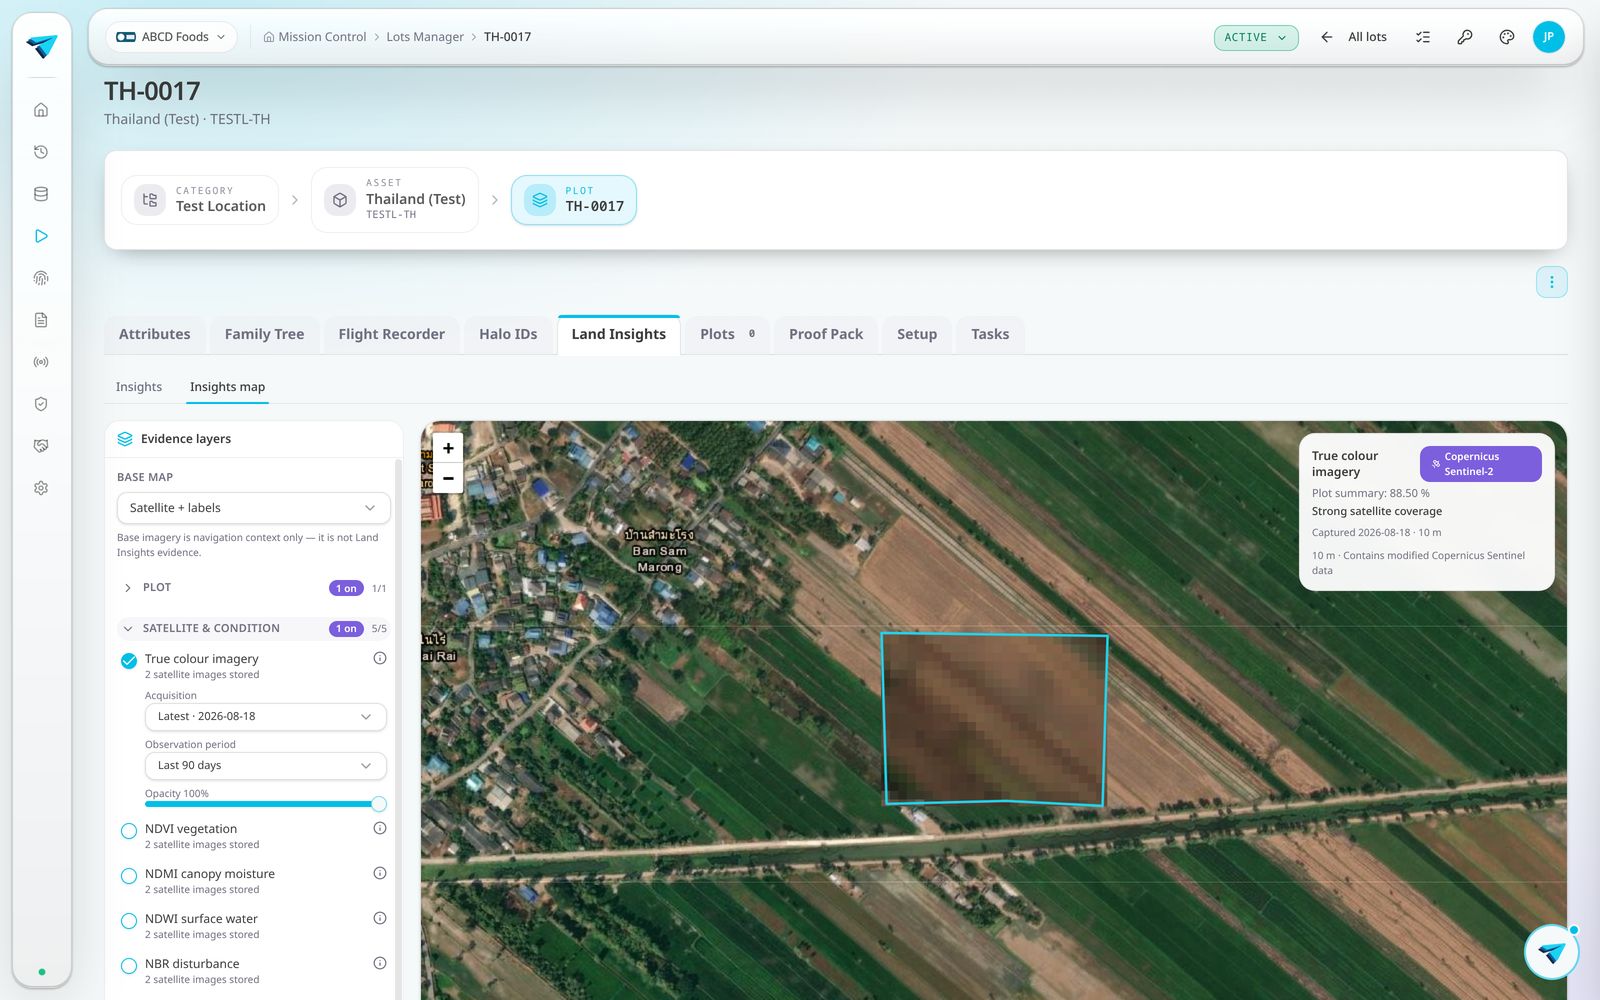
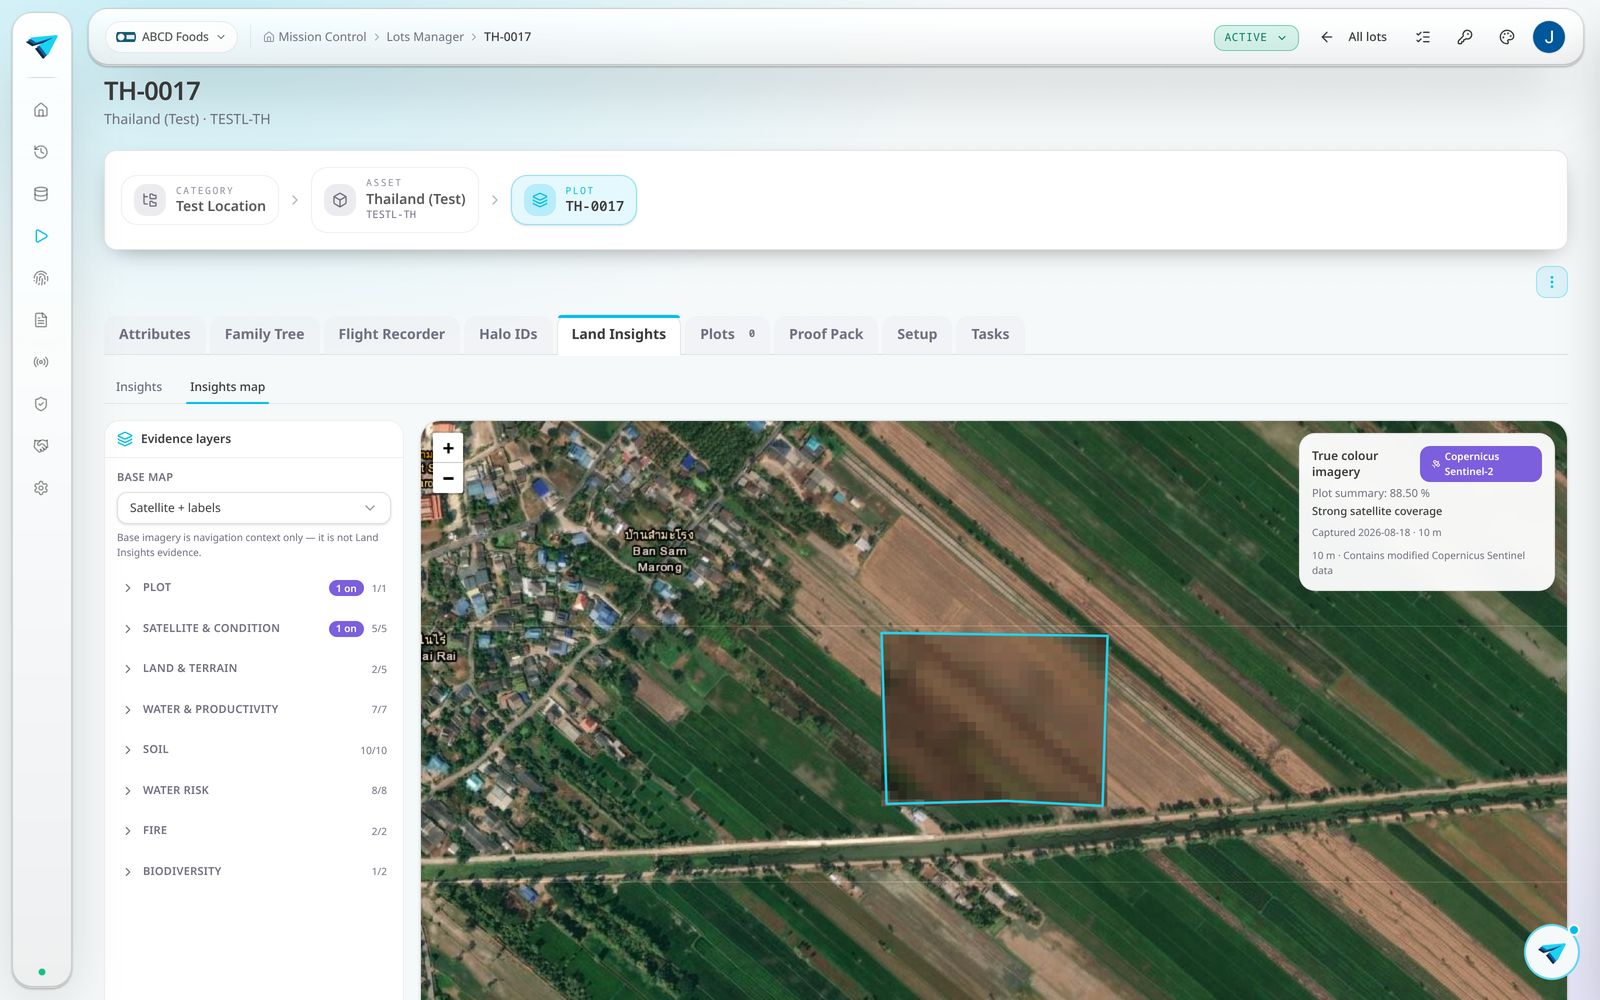
Switch layers on the map to compare forest, water, soil and jurisdictional data over the same boundary in a single view.
Scored across the portfolio
Every plot rolls up into a portfolio score so you can rank suppliers, target field visits and evidence improvement year on year.
Tied to your real boundaries
Insights run against the KML boundaries already held in Orbit, so the analysis always matches the land your lots actually came from.